I use Shelly Plus 2PM to control my external blinds so the choice was obvious - use Shelly 3EM. To get some idea how installation looks like, I watched Shelly 3EM Installation video by Jimmy James. Based on that, I've decided I can handle it myself.
Shelly 3EM Installation
The problem was space in our electrical cabinet. Because it's not only 1 spot for the meter but another 3 for the circuit breaker and place around input wires to put clamps. Eventually, I've hacked it for the beginning and put the circuit breaker outside of the cabinet. Just to see whether the meter works fine.

Setup Shelly 3EM In Home Assistant
Setup in Shelly web interface is easy - I just restricted access for admin, configured wifi and added Device name - I called in Main Power so it will look good in Home Assistant. Then I added the Shelly integration to my Home assistant which configured automatically all sensors. I remember small hick-up with discovering the device - you need to enter just IP address and then it will ask you for user/password (I was trying to add http://IP which does not work).

Later I have updated Shelly settings based on recommendation for generation 1 devices and set ColoT peer directly to my Home assistant IP address. It seems to me it speeds up updates in Home Assistant.

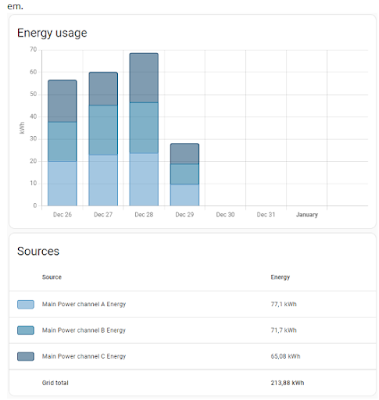
Energy Dashboard
For Energy dashboard in Home assistant, I just added all three channels/phases as Grid consumption - it nicely shows the consumption split by them.
Detailed Energy Graphs
To see detailed consumption, first I set up Total Power sensor in configuration.yaml (based on Jimmy video):
template:
    - name: Total Power
      unique_id: total_power_tmpl
      unit_of_measurement: W
      state_class: measurement
      device_class: energy
      state: >
        {% set phase1 = states('sensor.main_power_channel_a_power') | float %}
        {% set phase2 = states('sensor.main_power_channel_b_power') | float %}
        {% set phase3 = states('sensor.main_power_channel_c_power') | float %}
        {{ phase1 + phase2 + phase3 }}
And then using apexcharts-card graphs, I've set up cards showing consumption in the last hour, 6 hours, etc.
type: custom:apexcharts-card
graph_span: 1h
header:
  show: true
  title: Energy 1h
all_series_config:
  stroke_width: 1
series:
  - entity: sensor.total_power
    name: Total
    color: rgb(162, 185, 207)
  - entity: sensor.main_power_channel_a_power
    name: Phase A
    color: rgb(3, 169, 244)
  - entity: sensor.main_power_channel_b_power
    name: Phase B
    color: rgb(128, 233, 234)
  - entity: sensor.main_power_channel_c_power
    name: Phase C
    color: rgb(255, 191, 128)
The big spikes on 6h graph are when our boiler heats tank with warm water. The problem is it does it every ~2 hours even during night which is too often and thus costly…
The next part is to find out more data from the boiler.


No comments:
Post a Comment